Employment Intervention Demonstration Program (EIDP)
duration: 1 min. 53 sec.
slide 11
Transcript
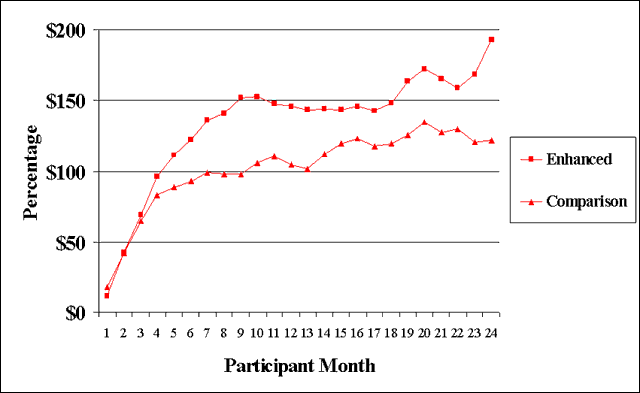
This graph shows the average number of dollars earned per month over the 24-month study period. Both groups are roughly equal in average earnings until around the 4th month of the study. After that, the lines diverge and, by the end of the study, enhanced condition participants are earning an average that is close to $200 per month, compared to around $120 per month in the comparison conditions.
The final outcome measured in the enhanced vs. the comparison groups was the proportion who worked at all for pay, including non-competitive and sub-minimum wage jobs. Starting with the third month of the study, the proportion of participants working for pay in enhanced groups ranged from 20% to approximately 38%. The range for the comparison group was 20% to approximately 31%. The comparison group actually did slightly better than the enhanced group for the first three months, but after that, the enhanced conditions did better and continued to do better throughout the study.
But we needed to go beyond just looking at these graphs to see if the enhanced interventions really made a difference. We needed to see whether certain participant features actually accounted for these differences. So, we controlled for a number of things that might have made the experimental and control groups different in their outcomes. These participant features included gender, ethnicity, age, level of education, prior work history, both positive and negative symptoms, marital status, co-residence with children, diagnosis of schizophrenia, co-occurring health problems or other disability, as well as whether the individuals received disability income. And we used these features, along with clients’ participation in either the enhanced or comparison programs, to predict the four employment outcomes I described earlier.
