Employment Intervention Demonstration Program (EIDP)
duration: 1 min. 21 sec.
slide 13

Transcript
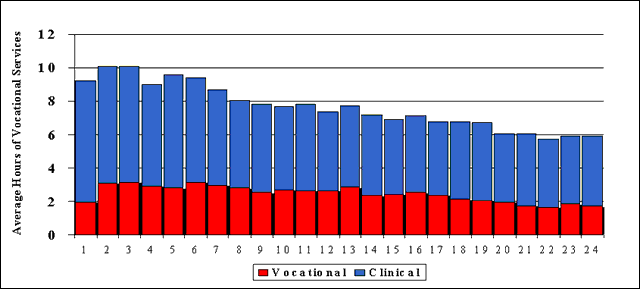
Here is what we found about services: First of all, people received many more hours of clinical services than vocational services. This finding is shown on the bar chart, which presents the average number of hours of clinical and vocational services received in each of the 24 study months. When we compare the size of the blue bars representing clinical services, with the size of the red bars representing vocational services, in every month, the blue bars are longer, meaning that, on average, people received more clinical than employment services.
The next two findings about services also concern differences between clinical and vocational services. Controlling for all other factors, those who received more total hours of vocational services had better employment outcomes. But on the other hand, those who received more total hours of clinical services had poorer vocational outcomes.
Let me repeat this finding since this is an important message to remember. The more vocational services people receive, the better the employment outcomes they achieve. That’s why it’s very important for programs to monitor the amount of vocational services they deliver and continue to serve consumers who want and need services with no time limits, even after consumers are working successfully.