Employment Intervention Demonstration Program (EIDP)
duration: 1 min. 45 sec.
slide 14

Transcript
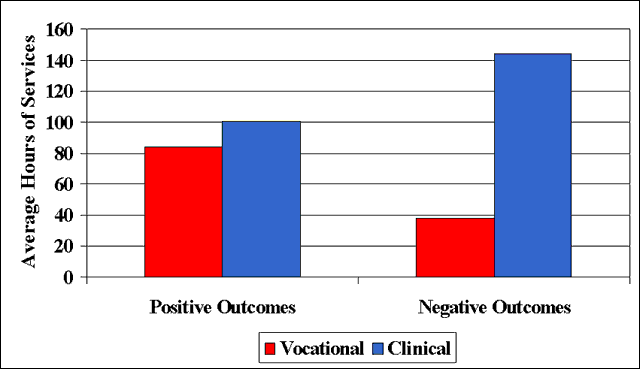
If we look at all of the participants followed by EIDP, we find that those with positive outcomes received roughly equal amounts of clinical and vocational services. Let’s look at the graph in this slide to review this finding. Please note that the vocational services are represented in the graph by the red bar and the clinical services are represented by the blue bar.
One of the vocational outcomes was working 40 or more hours in any given month. Here you will see that those with poor outcomes, or those who did not work 40 or more hours per month, received very few vocational services, and quite a lot of clinical services. Those with positive outcomes received roughly equal amounts of clinical and vocational services. Remember that this finding is for all of the participants in the study which included both the enhanced programs and the comparison group.
However, we learn something more when the individuals in the enhanced programs are compared to those in the comparison groups. Remember, early on we discussed that individuals were randomly assigned to the type of vocational services that they received at each site. In other words, when people were newly enrolled in a center’s program, they had an equal chance of entering the comparison (or control) condition OR the enhanced (or experimental) condition.
In the enhanced programs, those who received more vocational AND clinical services had better outcomes, while this was not true for those in the comparison groups. This may be because the clinical and vocational services were well integrated in the enhanced programs, but not as well combined or coordinated in the comparison programs. Let’s look at the next slide to discuss this finding further.